Market Outlook
February 14, 2017
Market Cues
Domestic Indices
Chg (%)
(Pts)
(Close)
Indian markets are likely to start off on a positive note today tracking SGX nifty.
BSE Sensex
0.1
17
28,352
U.S. markets climbed to new record highs Monday as investors remained bullish on
Nifty
0.1
12
8,805
President Donald Trump's economic agenda.
Mid Cap
(0.4)
(50)
13,418
European markets closed higher on Monday as investors eyed fresh data and
Small Cap
(0.6)
(78)
13,524
digested the European Commission's latest economic forecast for the euro zone.
Bankex
0.1
32
23,207
Indian markets ended a choppy session largely unchanged on Monday, with the
dollar's broad-based strength in currency markets and weak earnings updates from
Global Indices
Chg (%)
(Pts)
(Close)
the likes of Bank of Baroda, Coal India and Idea Cellular weighing on markets.
Dow Jones
0.7
143
20,412
Investors also awaited January consumer inflation data due out later in the day for
Nasdaq
0.5
30
5,764
fresh clues on whether the RBI has room to cut rates.
FTSE
0.3
20
7,279
News Analysis
Nikkei
0.4
80
19,459
Review: Glaxo Pharmaceuticals
Hang Seng
0.6
136
23,711
Preview: Sun Pharmaceuticals
Shanghai Com
0.6
20
3,217
Detailed analysis on Pg2
Investor’s Ready Reckoner
Advances / Declines
BSE
NSE
Advances
1,077
547
Key Domestic & Global Indicators
Declines
1,840
1,119
Stock Watch: Latest investment recommendations on 150+ stocks
Refer Pg7 onwards
Unchanged
154
71
Top Picks
Volumes (` Cr)
CMP
Target
Upside
Company
Sector
Rating
(`)
(`)
(%)
BSE
3,506
Amara Raja Batteries Auto & Auto Ancillary
Buy
869
1,009
16.1
NSE
19,892
Alkem Laboratories
Pharmaceuticals
Accumulate
1,847
1,989
7.7
HCL Tech
IT
Buy
827
1,000
20.9
Net Inflows (` Cr)
Net
Mtd
Ytd
Power Grid Corp.
Power
Accumulate
203
223
9.8
FII
555
2,192
2,146
Navkar Corp.
Others
Buy
174
265
52.6
More Top Picks on Pg5
MFs
(12)
1,054
6,269
Key Upcoming Events
Top Gainers
Price (`)
Chg (%)
Previous
Consensus
Date
Region
Event Description
Reading
Expectations
Suzlon
18
4.9
Feb 14 China
Consumer Price Index (YoY)
2.10
2.40
Exideind
216
3.7
Feb 14 Euro Zone Euro-Zone GDP s.a. (QoQ)
0.50
0.50
Iifl
341
3.6
Feb 14 India
Monthly Wholesale Prices YoY%
3.39
4.35
Pel
1,832
3.4
Feb 14 Germany GDP nsa (YoY)
1.50
1.40
Eichermot
24,779
3.3
Feb 14 UK
CPI (YoY)
1.60
1.90
Feb 14 US
Producer Price Index (mom)
0.60
More Events on Pg6
Top Losers
Price (`)
Chg (%)
Bankbaroda
169
(10.3)
Srf
1,594
(9.0)
Ifci
29
(6.5)
Crompgreav
67
(6.2)
Unitech
6
(6.0)
As on February 13, 2017
Market Outlook
February 14, 2017
News Analysis
Review
Glaxo Pharmaceuticals (CMP: `2,690 / TP: / Upside: )
Glaxo Pharmaceuticals, posted results lower than expected on all fronts. In sales,
the company posted sales of `689cr V/s `700cr expected a yoy de-growth of
5.6%. The sales during the quarter were impacted on back of the mandatory price
cuts growth by
5.0% in the current quarter. The estimated impact of
demonetization adversely impacted sales further by
5%, mainly in acute &
consumer brands. On EBITDA front, the company posted EBITDA of 5.1% V/s
9.1% expected V/s 11.6% in 3QFY2016. Consequently, Adj. PAT came in at
`40.8cr V/s `78.4cr expected, V/s `81.0cr in 3QFY2016, de-growth of 49.6% yoy.
The growth in the net profit was lower, on lower than expected OPM’s, which was
eroded on back of lower sales and pricing pressures. We maintain our Neutral
rating on the stock.
Preview
Sun Pharmaceuticals (CMP: `655 / TP: `890 / Upside: 29.3%)
Sun Pharmaceuticals is expected to post decent set of numbers. The sales are
expected to come in at `7800cr V/s `7047cr in 3QFY2016, yoy growth of 10.7%,
driven equally by domestic and Exports sales. On EBITDA front, the company is
expected to post an EBITDA of 33.6% V/s 30.3% in 3QFY2016. Consequently, Adj.
PAT is expected to come in at `1,733cr V/s `1,417cr in 3QFY2016, growth of
22.3% yoy. We maintain our Buy rating on the stock.
Y/E
Sales OPM
PAT
EPS ROE P/E P/BV EV/EBITDA EV/Sales
March
(` cr)
(%)
(` cr)
(`)
(%)
(x)
(x)
(x)
(x)
FY2017E
31,129
32.0
7,260
30.2
20.0
21.7
3.5
14.7
4.7
FY2018E
35,258
32.9
8,495
35.3
20.1
18.6
2.9
12.0
3.9
Economic and Political News
CPI-based inflation eases to a five-year low of 3.17% in January
India Inc's FDI overseas down by 57% to $1.82 bn
China launches anti-dumping probe against Indian manufacturers
Corporate News
HPCL Q3 net up 53% at `1,590cr
NMDC Q3 net profit up 41% to `595cr on firm iron ore prices
Nalco Q3 net dips marginally to `144cr
Market Outlook
February 14, 2017
Quarterly Bloomberg Brokers Consensus Estimate
Tata Motors Ltd Consol - Feb 14, 2017
Particulars ( ` cr)
3QFY17E
3QFY16
y-o-y (%)
2QFY17
q-o-q (%)
Net sales
67,407
71,686
(6.0)
65,141
3.5
EBITDA
8,995
9,380
(4.1)
6,283
43.2
EBITDA margin (%)
13.3
13.1
9.6
Net profit
2,749
3,508
(21.6)
828
231.9
Sun Pharma industries Ltd Consol - Feb 14, 2017
Particulars ( ` cr)
3QFY17E
3QFY16
y-o-y (%)
2QFY17
q-o-q (%)
Net sales
7,901
7,047
12.1
7,764
1.8
EBITDA
2,478
2,169
14.2
3,168
(21.8)
EBITDA margin (%)
31.4
30.8
40.8
Net profit
1,635
1,417
15.4
2,235
(26.9)
Adani Ports and Special Economic Zone Lt - Feb 14, 2017
Particulars ( ` cr)
3QFY17E
3QFY16
y-o-y (%)
2QFY17
q-o-q (%)
Net sales
1,850
898
106.0
1,278
44.8
EBITDA
1,221
749
63.1
1,001
22.0
EBITDA margin (%)
66.0
83.4
78.3
Net profit
851
619
37.4
917
(7.2)
DLF Ltd - Feb 14, 2017
Particulars ( ` cr)
3QFY17E
3QFY16
y-o-y (%)
2QFY17
q-o-q (%)
Net sales
1,924
2,828
(32.0)
2,071
(7.1)
EBITDA
773
1202
(35.7)
1,020
(24.3)
EBITDA margin (%)
40.2
42.5
49.3
Net profit
88
164
(46.6)
202
(56.7)
Jindal Steel & Power Ltd Consol - Feb 14, 2017
Particulars ( ` cr)
3QFY17E
3QFY16
y-o-y (%)
2QFY17
q-o-q (%)
Net sales
4,906
4,133
18.7
4,485
9.4
EBITDA
1,039
350
196.4
680
52.7
EBITDA margin (%)
21.2
8.5
15.2
Net profit
(425)
(573)
25.8
(746)
43.0
Rural Electrification Corp Ltd - Feb 14, 2017
Particulars ( ` cr)
3QFY17E
3QFY16
y-o-y (%)
2QFY17
q-o-q (%)
Net sales
2,483
6,018
(58.9)
5,957
(58.5)
EBITDA
2446
5,568
(56.1)
5,722
(57.3)
EBITDA margin (%)
98.5
92.5
96.1
Net profit
1,400
1,370
2.2
1,751
(20.1)
Market Outlook
February 14, 2017
Vedanta Ltd - Feb 14, 2017
Particulars ( ` cr)
3QFY17E
3QFY16
y-o-y (%)
2QFY17
q-o-q (%)
Net sales
19393
14877
30.4
15859
22.3
EBITDA
5937
3106
91.1
4668
27.2
EBITDA margin (%)
30.6
20.9
29.4
Net profit
1990
499
299
1252
58.9
Market Outlook
February 14, 2017
Top Picks HHHHH
Large Cap
Market Cap
CMP
Target
Upside
Company
Rationale
(` Cr)
(`)
(`)
(%)
To outpace battery industry growth due to better
Amara Raja Batteries
14,841
869
1,009
16.1
technological products leading to market share gains in both
the automotive OEM and replacement segments.
Strong growth in domestic business due to its leadership in
Alkem Laboratories
22,088
1,847
1,989
7.7
acute therapeutic segment. Alkem expects to launch more
products in USA, which bodes for its international business.
The stock is trading at attractive valuations and is factoring
HCL Tech
1,16,699
827
1,000
20.9
all the bad news.
Back on the growth trend, expect a long term growth of 14%
Infosys
2,25,905
984
1,249
27.0
to be a US$20bn in FY2020.
Strong order backlog and improvement in execution would
Larsen & Toubro
1,39,645
1,497
1,634
9.1
trigger the growth for the L&T
One of the largest pharma companies with strong
Lupin
65,341
1,448
1,809
25.0
international presence. It has a rich pipeline of ANDAs which
is also one of the largest among the generic companies.
Going forward, we expect the company to report strong top-
Power Grid Corporation
1,06,227
203
223
9.8
line CAGR of ~16% and bottom-line CAGR of ~19% over
FY16-18 on back of strong capitalization guidance
Source: Company, Angel Research
Mid Cap
Market Cap
CMP
Target
Upside
Company
Rationale
(` Cr)
(`)
(`)
(%)
We expect the company would report strong profitability
Asian Granito
827
275
351
27.8
owing to better product mix, higher B2C sales and
amalgamation synergy.
Among the top 4 players in the consumer durables segment.
Bajaj Electricals
2,676
264
295
11.6
Improved profitability backed by turn around in E&P segment.
Strong order book lends earnings visibility.
Favourable outlook for the AC industry to augur well for
Cooling products business which is out pacing the market
Blue Star
5,242
549
634
15.5
growth. EMPPAC division's profitability to improve once
operating environment turns around.
With a focus on the low and medium income (LMI) consumer
Dewan Housing Finance
9,605
307
350
14.1
segment, the company has increased its presence in tier-II &
III cities where the growth opportunity is immense.
Strong loan growth backed by diversified loan portfolio and
adequate CAR. ROE & ROA likely to remain decent as risk of
Equitas Holdings
6,161
184
235
27.9
dilution remains low. Attractive valuations considering
growth.
Economic recovery to have favourable impact on advertising
& circulation revenue growth. Further, the acquisition of a
Jagran Prakashan
6,105
187
225
20.5
radio business (Radio City) would also boost the company's
revenue growth.
High order book execution in EPC segment, rising B2C sales
KEI Industries
1,312
169
207
22.7
and higher exports to boost the revenues and profitability
Speedier execution and speedier sales, strong revenue
Mahindra Lifespace
1,430
348
522
49.9
visibilty in short-to-long run, attractive valuations
Higher growth in domestic branded sales and healthy export
Mirza International
1,107
92
107
16.2
to boost the profitability.
Massive capacity expansion along with rail advantage at ICD
Navkar Corporation
2,476
174
265
52.6
as well CFS augurs well for the company
Market leadership in Hindi news genre and no. 2 viewership
ranking in English news genre, exit from the radio business,
TV Today Network
1,611
270
385
42.5
and anticipated growth in ad spends by corporates to benefit
the stock.
Market Outlook
February 14, 2017
Key Upcoming Events
Result Calendar
Date
Company
Tata Motors, FAG Bearings, Rural Elec.Corp., Jindal Steel, Sesa Goa, MOIL, Monnet Ispat, Prakash Industries, Finolex
Feb 14, 2017
Cables, Tree House, Surya Roshni, DLF, Unitech, HDIL, MT Educare, S H Kelkar & Co.
Feb 15, 2017
Nestle
Feb 20, 2017
Ambuja Cements
Feb 21, 2017
ITD Cementation
Source: Bloomberg, Angel Research
Global economic events release calendar
Date
Time
Country
Event Description
Unit
Period
Bloomberg Data
Last Reported Estimated
Feb 14, 2017 7:00AM
China
Consumer Price Index (YoY)
% Change
Jan
2.10
2.40
3:30PM
Euro Zone
Euro-Zone GDP s.a. (QoQ)
% Change
4Q P
0.50
0.50
12:00PM
India
Monthly Wholesale Prices YoY%
% Change
Jan
3.39
4.35
12:30PM
Germany
GDP nsa (YoY)
% Change
4Q P
1.50
1.40
3:00PM
UK
CPI (YoY)
% Change
Jan
1.60
1.90
US
Producer Price Index (mom)
% Change
Jan
0.60
--
Feb 15, 2017 3:00PM
UK
Jobless claims change
% Change
Jan
(10.10)
0.50
7:45PM
US
Industrial Production
%
Jan
0.83
--
7:00PM
US
Consumer price index (mom)
% Change
Jan
0.30
0.30
Feb 16, 2017 7:00PM
US
Initial Jobless claims
Thousands
Feb 11
234.00
244.00
7:00PM
US
Housing Starts
Thousands
Jan
1,226.00
1,226.00
7:00PM
US
Building permits
Thousands
Jan
1,228.00
1,230.00
Feb 20, 2017 8:30PM
Euro Zone
Euro-Zone Consumer Confidence
Value
Feb A
(4.90)
--
Feb 21, 2017 2:00PM
Germany
PMI Services
Value
Feb P
53.40
--
2:00PM
Germany
PMI Manufacturing
Value
Feb P
56.40
--
Feb 22, 2017 8:30PM
US
Existing home sales
Million
Jan
5.49
5.55
3:30PM
Euro Zone
Euro-Zone CPI (YoY)
%
Jan F
1.80
--
3:00PM
UK
GDP (YoY)
% Change
4Q P
2.20
--
Feb 24, 2017 8:30PM
US
New home sales
Thousands
Jan
536.00
565.00
Feb 28, 2017 8:30PM
US
Consumer Confidence
S.A./ 1985=100
Feb
111.80
111.00
7:00PM
US
GDP Qoq (Annualised)
% Change
4Q S
1.90
2.00
Mar 1, 2017
2:25PM
Germany
Unemployment change (000's)
Thousands
Feb
(26.00)
--
3:00PM
UK
PMI Manufacturing
Value
Feb
55.90
--
6:30AM
China
PMI Manufacturing
Value
Feb
51.30
--
Mar 8, 2017
China
Exports YoY%
% Change
Feb
7.90
--
Mar 9, 2017
3:00PM
UK
Industrial Production (YoY)
% Change
Jan
4.30
--
Mar 10, 2017 5:30PM
India
Industrial Production YoY
% Change
Jan
(0.40)
--
7:00PM
US
Change in Nonfarm payrolls
Thousands
Feb
227.00
--
6:15PM
Euro Zone
ECB announces interest rates
%
Mar 9
--
--
Source: Bloomberg, Angel Research
Market Outlook
February 14, 2017
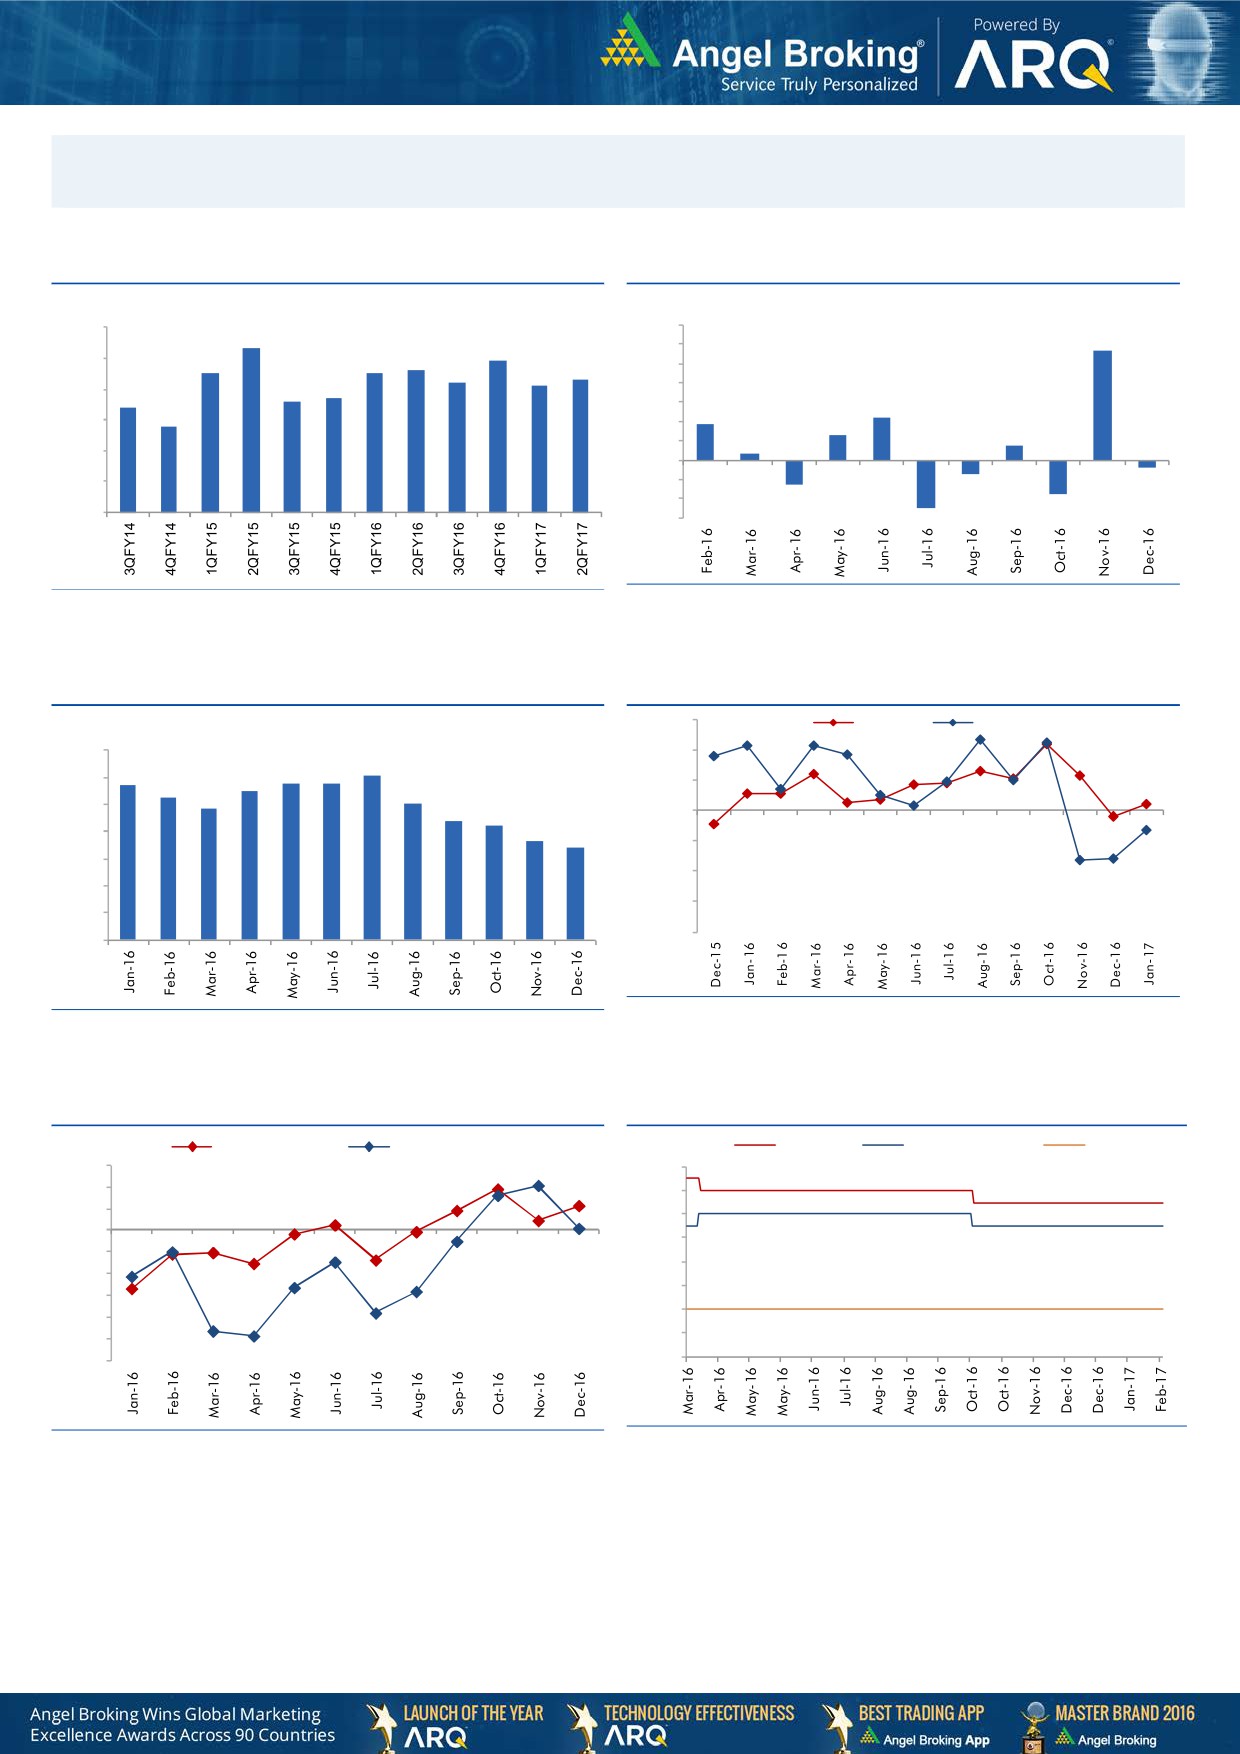
Macro watch
Exhibit 1: Quarterly GDP trends
Exhibit 2: IIP trends
(%)
(%)
9.0
7.0
8.3
5.7
7.9
6.0
8.0
7.5
7.5
7.6
7.3
5.0
7.2
7.1
6.6
6.7
4.0
7.0
6.4
3.0
2.2
5.8
1.9
6.0
2.0
1.3
0.7
1.0
0.3
5.0
-
4.0
(1.0)
(0.7)
(0.4)
(2.0)
(1.3)
3.0
(1.8)
(3.0)
(2.5)
Source: MOSPI, Angel Research
Source: CSO, Angel Research
Exhibit 3: Monthly CPI inflation trends
Exhibit 4: Manufacturing and services PMI
56.0
Mfg. PMI
Services PMI
(%)
7.0
54.0
6.1
5.7
5.8
5.8
6.0
5.3
5.5
52.0
5.1
4.8
5.0
4.4
4.2
50.0
3.6
4.0
3.4
48.0
3.0
46.0
2.0
44.0
1.0
42.0
-
Source: Market, Angel Research; Note: Level above 50 indicates expansion
Source: MOSPI, Angel Research
Exhibit 5: Exports and imports growth trends
Exhibit 6: Key policy rates
(%)
Exports yoy growth
Imports yoy growth
(%)
Repo rate
Reverse Repo rate
CRR
15.0
7.00
10.0
6.50
5.0
6.00
0.0
5.50
(5.0)
5.00
(10.0)
4.50
(15.0)
4.00
(20.0)
3.50
(25.0)
(30.0)
3.00
Source: Bloomberg, Angel Research
Source: RBI, Angel Research
Market Outlook
February 14, 2017
Global watch
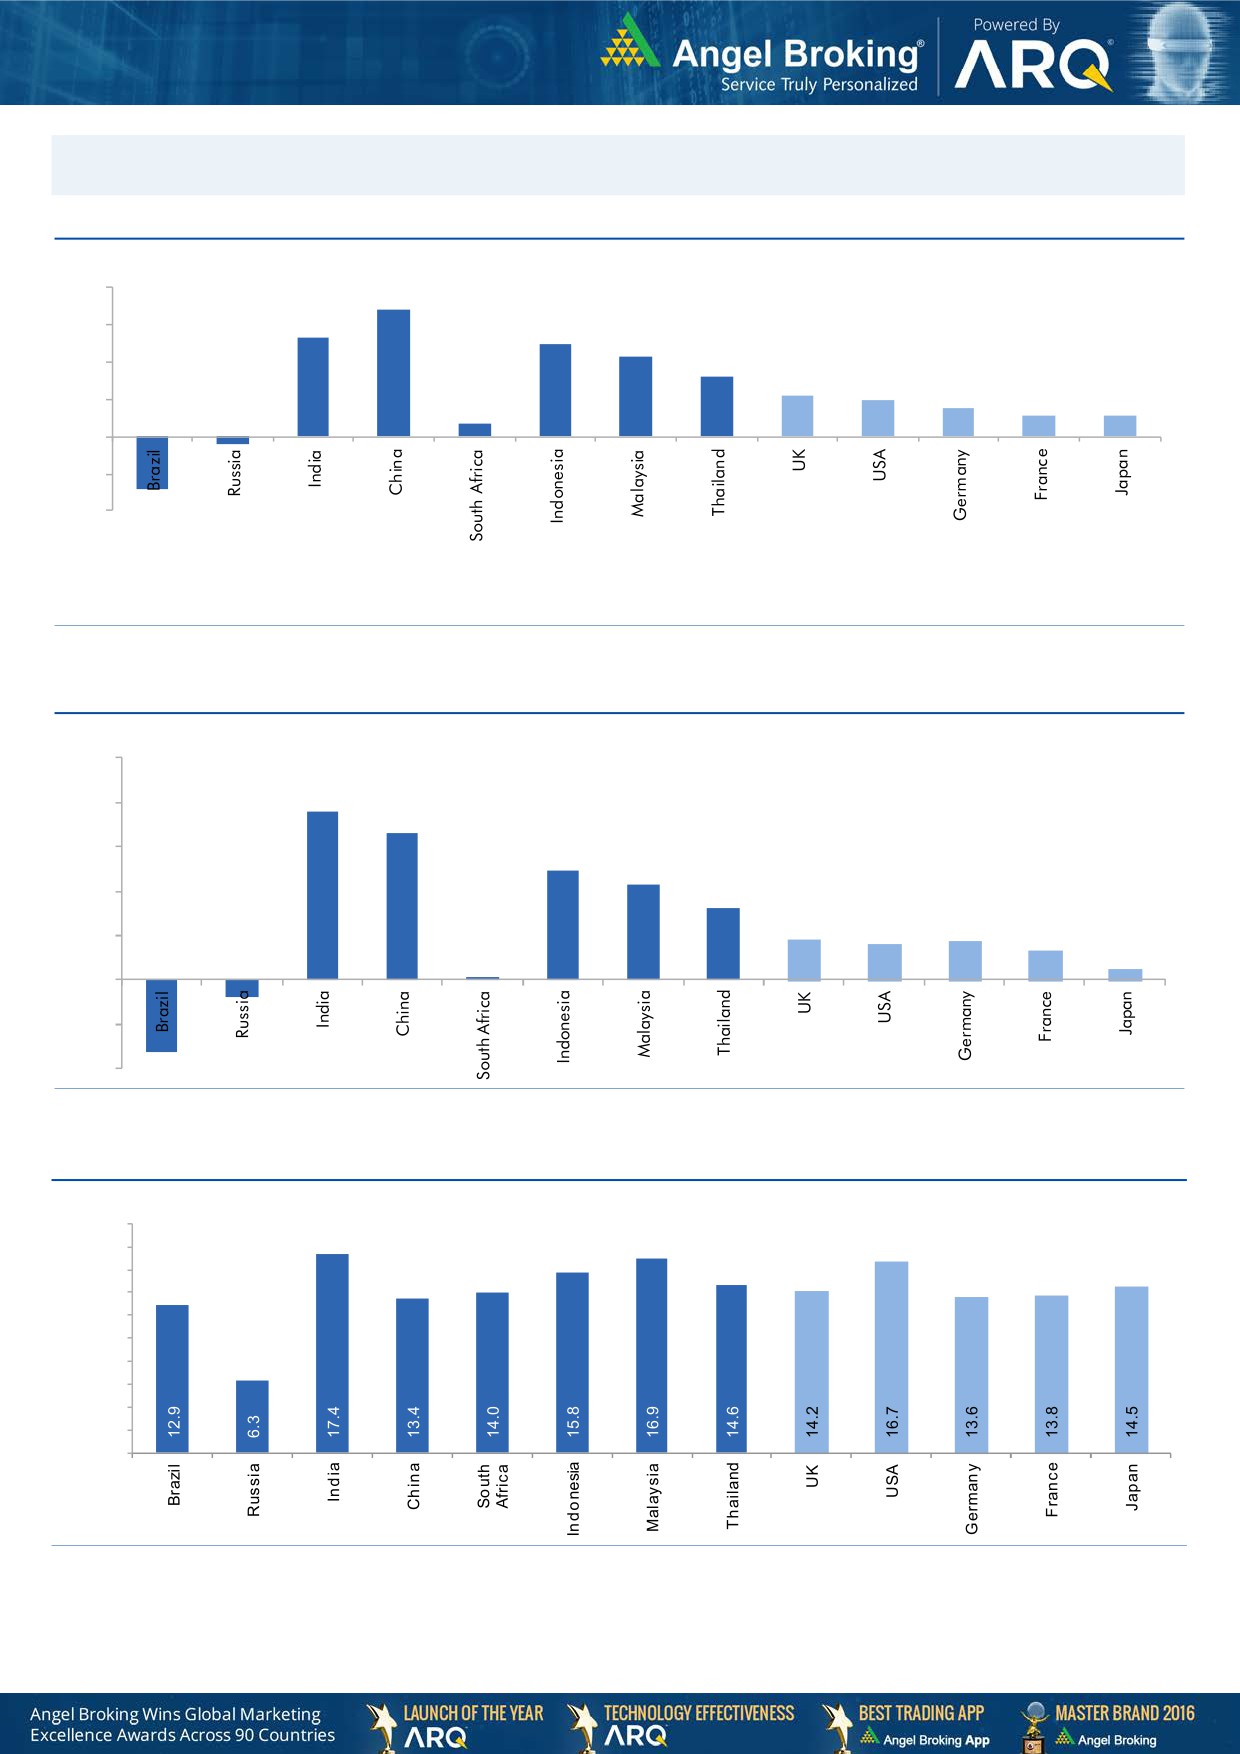
Exhibit 1: Latest quarterly GDP Growth (%, yoy) across select developing and developed countries
(%)
8.0
6.8
0.7
5.3
6.0
4.9
4.3
4.0
3.2
2.2
1.9
1.5
2.0
1.1
1.1
-
(2.0)
(0.4)
(4.0)
(2.9)
Source: Bloomberg, Angel Research
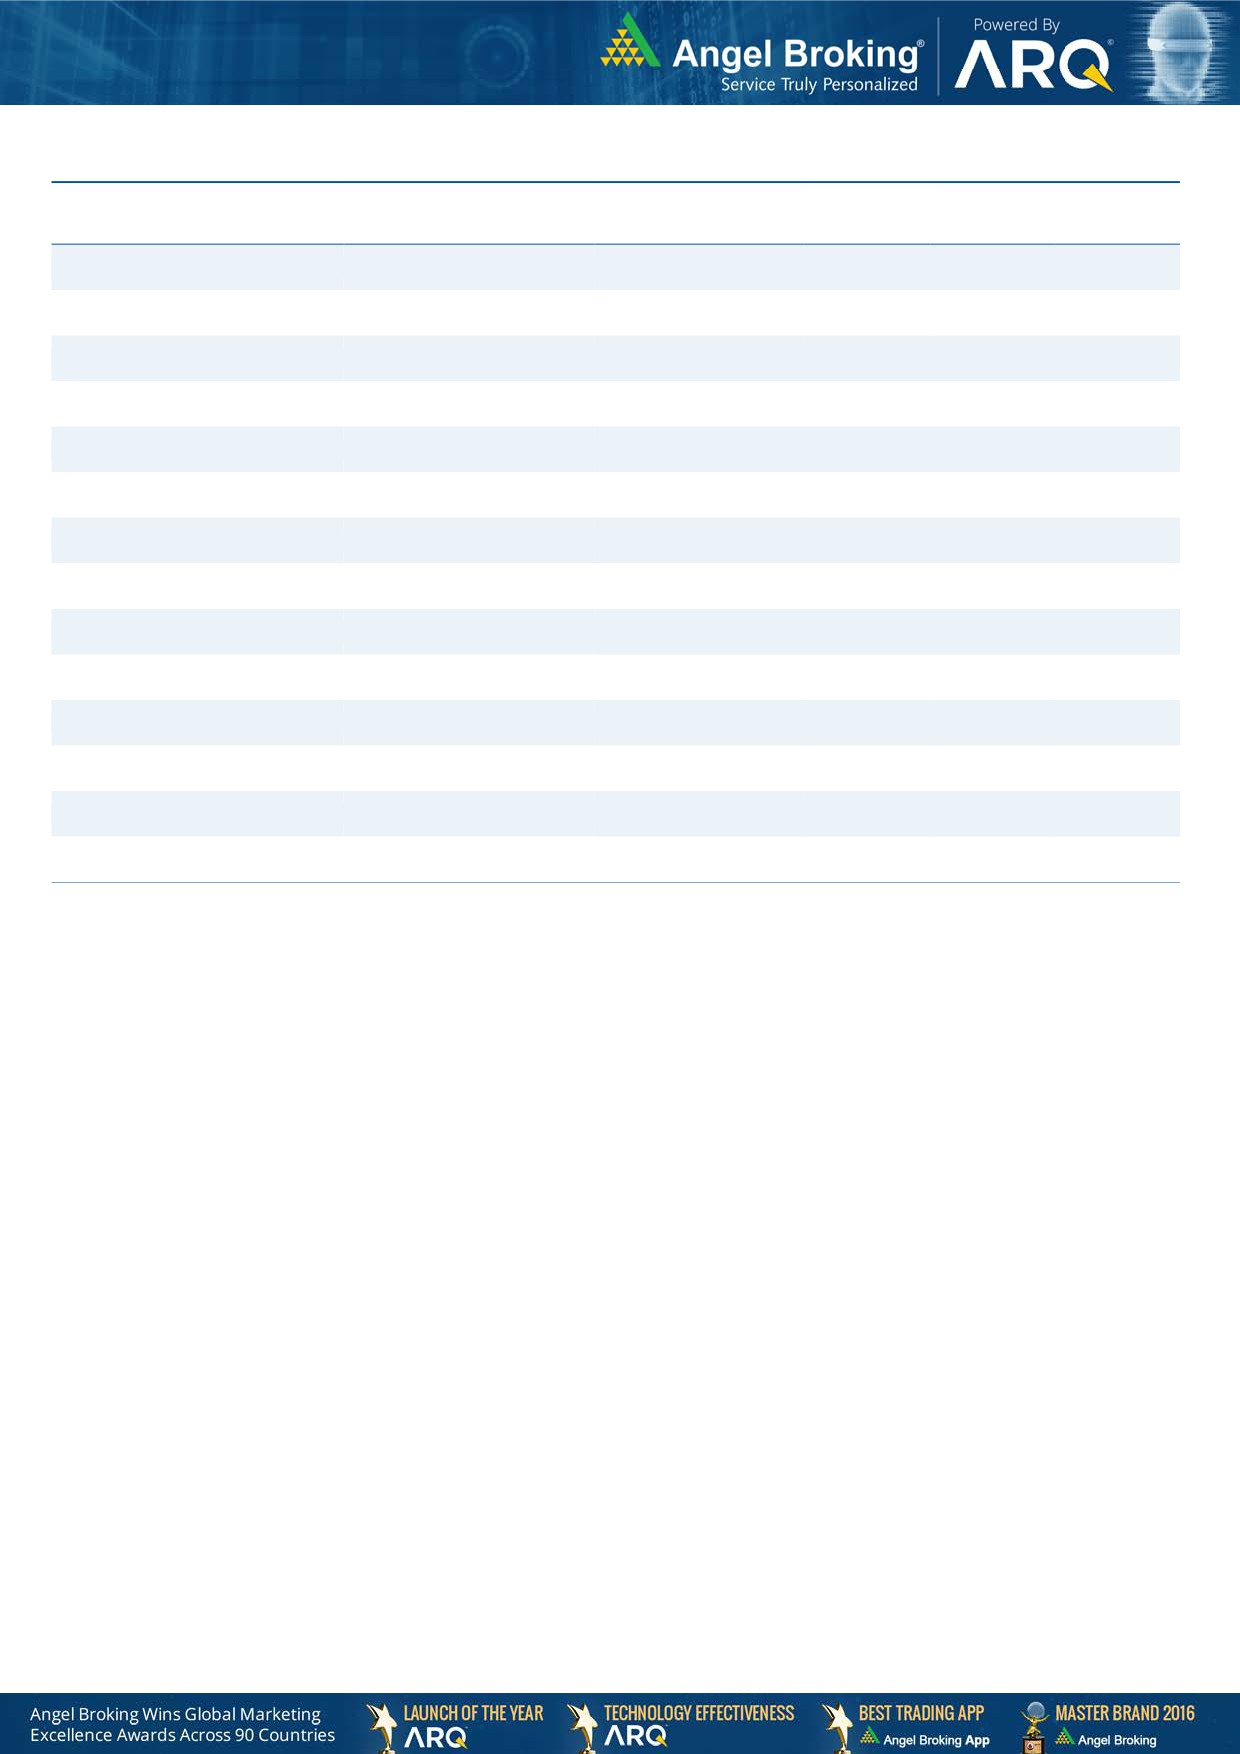
Exhibit 2: 2016 GDP Growth projection by IMF (%, yoy) across select developing and developed countries
(%)
10.0
7.6
8.0
6.6
6.0
4.9
4.3
4.0
3.2
1.8
1.7
1.6
2.0
1.3
(0.8)
0.5
(3.3)
0.1
-
(2.0)
(4.0)
Source: IMF, Angel Research
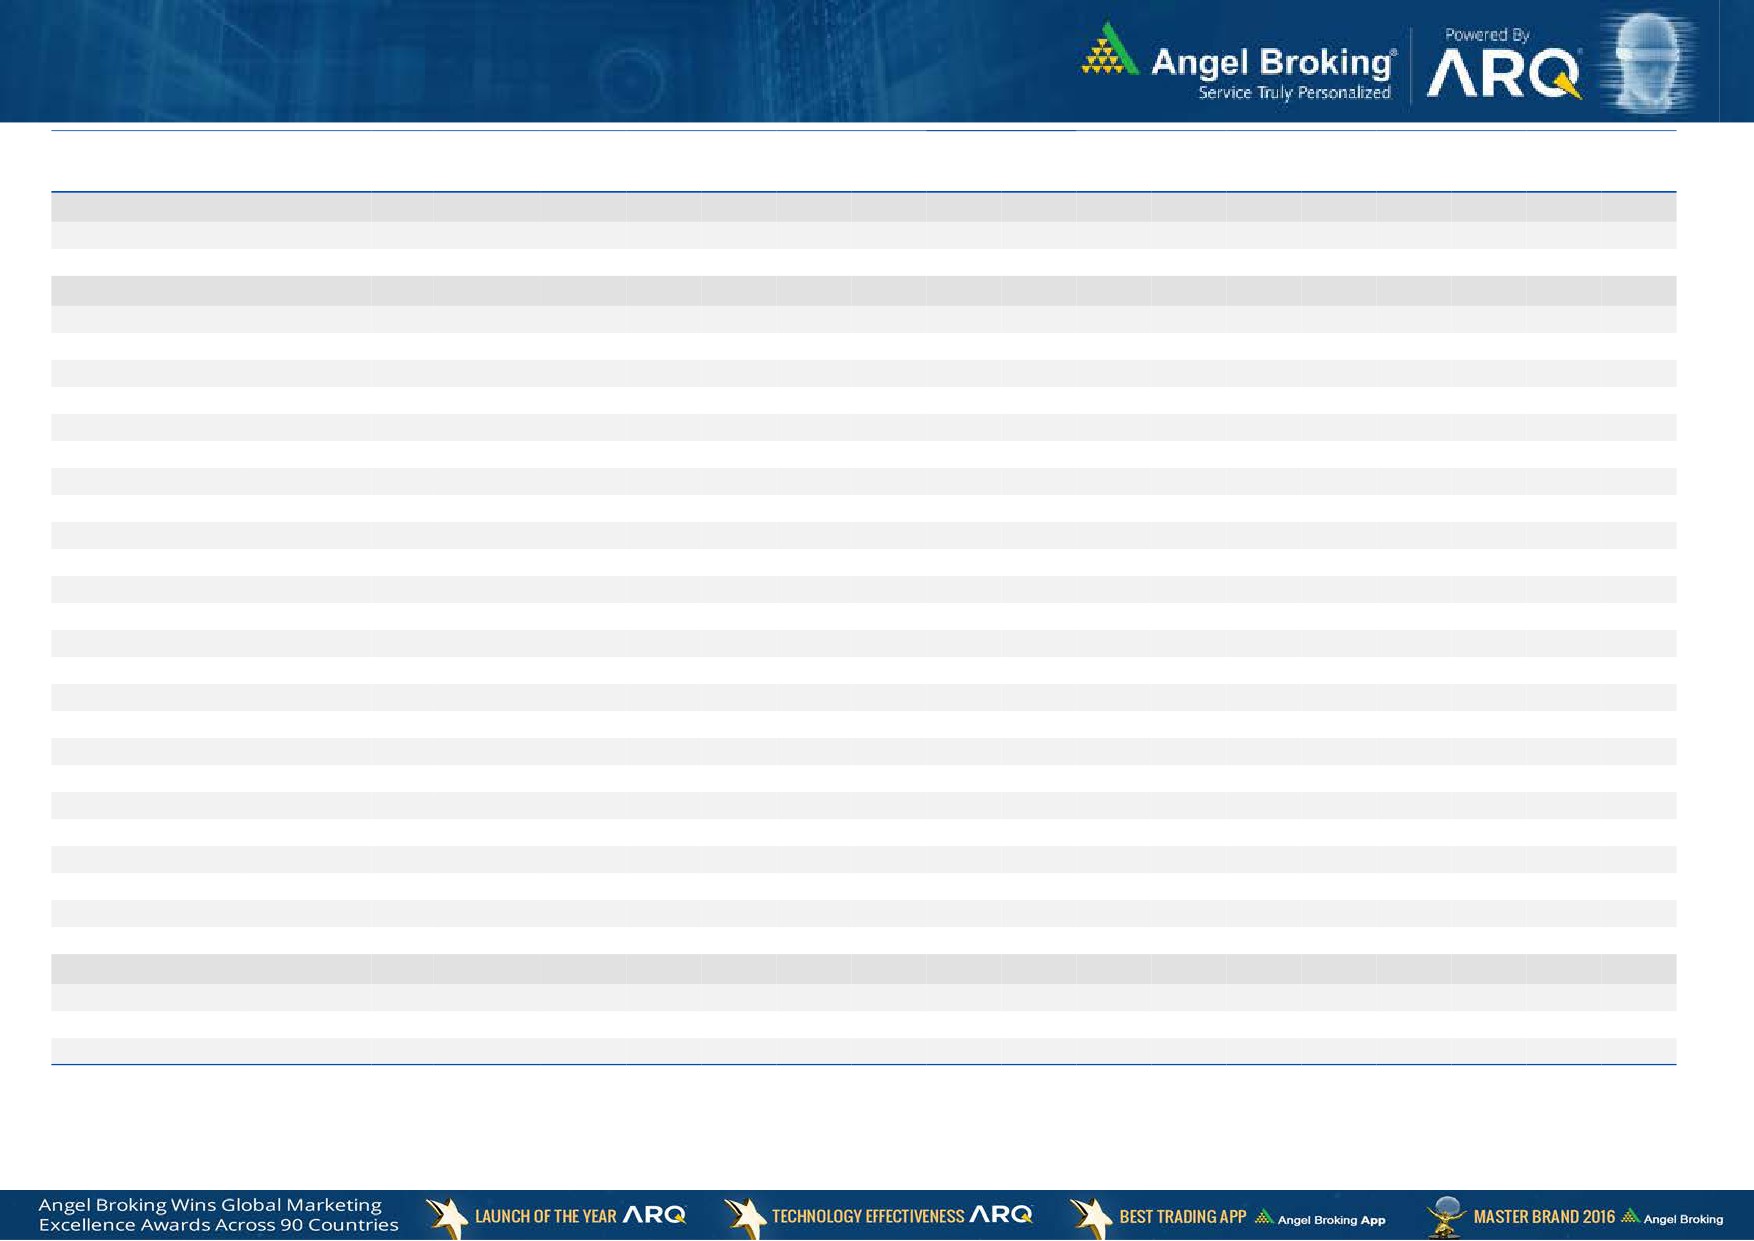
Exhibit 3: One year forward P-E ratio across select developing and developed countries
(x)
20.0
18.0
16.0
14.0
12.0
10.0
8.0
6.0
4.0
2.0
-
Source: IMF, Angel Research
Market Outlook
February 14, 2017
Exhibit 4: Relative performance of indices across globe
Returns (%)
Country
Name of index
Closing price
1M
3M
1YR
Brazil
Bovespa
66,968
7.2
9.4
67.0
Russia
Micex
2,161
(2.3)
6.9
23.2
India
Nifty
8,805
5.1
6.1
19.2
China
Shanghai Composite
3,217
2.0
2.2
21.1
South Africa
Top 40
45,942
0.5
3.3
6.8
Mexico
Mexbol
47,662
3.8
5.4
10.6
Indonesia
LQ45
901
1.8
(2.8)
6.7
Malaysia
KLCI
1,710
2.5
3.6
3.2
Thailand
SET 50
992
1.1
5.0
20.8
USA
Dow Jones
20,412
2.3
9.8
26.0
UK
FTSE
7,279
(0.2)
6.6
24.2
Japan
Nikkei
19,459
1.7
13.3
13.2
Germany
DAX
11,774
2.2
10.1
25.4
France
CAC
4,888
0.5
8.4
15.3
Source: Bloomberg, Angel Research
Stock Watch
February 14, 2017
Company Name
Reco
CMP
Target
Mkt Cap
Sales ( Čcr )
OPM(%)
EPS (Č)
PER(x)
P/BV(x)
RoE(%)
EV/Sales(x)
(Č)
Price ( Č)
( Č cr )
FY17E FY18E
FY17E
FY18E
FY17E
FY18E
FY17E
FY18E
FY17E
FY18E
FY17E
FY18E
FY17E
FY18E
Agri / Agri Chemical
Rallis
Neutral
240
-
4,667
1,937
2,164
13.3
14.3
9.0
11.0
26.7
21.8
4.6
4.1
18.4
19.8
2.5
2.2
United Phosphorus
Neutral
729
-
36,969
15,176
17,604
18.5
18.5
37.4
44.6
19.5
16.4
3.8
3.2
21.4
21.2
2.5
2.2
Auto & Auto Ancillary
Ashok Leyland
Buy
92
111
26,211
19,591
21,533
11.6
11.9
4.6
5.3
20.2
17.3
4.2
3.7
20.6
21.5
1.3
1.1
Bajaj Auto
Neutral
2,806
-
81,208
25,093
27,891
19.5
19.2
143.9
162.5
19.5
17.3
5.5
4.7
30.3
29.4
3.0
2.6
Bharat Forge
Neutral
1,041
-
24,233
7,726
8,713
20.5
21.2
35.3
42.7
29.5
24.4
5.4
4.9
18.9
20.1
3.2
2.8
Eicher Motors
Neutral
24,859
-
67,625
16,583
20,447
17.5
18.0
598.0
745.2
41.6
33.4
14.2
10.8
41.2
38.3
3.9
3.1
Gabriel India
Accumulate
115
130
1,648
1,544
1,715
9.0
9.3
5.4
6.3
21.3
18.2
4.0
3.6
18.9
19.5
1.0
0.9
Hero Motocorp
Accumulate
3,226
3,541
64,428
30,958
34,139
15.7
15.7
193.6
208.3
16.7
15.5
6.5
5.4
34.2
30.5
1.9
1.7
Jamna Auto Industries Neutral
200
-
1,596
1,486
1,620
9.8
9.9
15.0
17.2
13.4
11.7
2.9
2.5
21.8
21.3
1.1
1.0
L G Balakrishnan & Bros Neutral
544
-
853
1,302
1,432
11.6
11.9
43.7
53.0
12.4
10.3
1.8
1.6
13.8
14.2
0.7
0.7
Mahindra and Mahindra Neutral
1,297
-
80,571
46,534
53,077
11.6
11.7
67.3
78.1
19.3
16.6
3.1
2.7
15.4
15.8
1.7
1.5
Maruti
Accumulate
6,023
6,560
181,929
67,822
83,288
16.0
16.4
253.8
312.4
23.7
19.3
5.5
4.4
23.0
22.9
2.3
1.8
Minda Industries
Neutral
373
-
2,957
2,728
3,042
9.0
9.1
68.2
86.2
5.5
4.3
1.2
1.0
23.8
24.3
1.1
1.0
Motherson Sumi
Neutral
351
-
49,266
45,896
53,687
7.8
8.3
13.0
16.1
26.9
21.8
8.7
6.9
34.7
35.4
1.1
1.0
Rane Brake Lining
Neutral
981
-
776
511
562
11.3
11.5
28.1
30.9
34.9
31.7
5.3
4.8
15.3
15.0
1.7
1.5
Setco Automotive
Neutral
36
-
487
741
837
13.0
13.0
15.2
17.0
2.4
2.1
0.4
0.4
15.8
16.3
1.0
0.9
Tata Motors
Neutral
505
-
145,919
300,209
338,549
8.9
8.4
42.7
54.3
11.9
9.3
1.9
1.6
15.6
17.2
0.6
0.5
TVS Motor
Neutral
411
-
19,547
13,390
15,948
6.9
7.1
12.8
16.5
32.2
24.9
8.0
6.4
26.3
27.2
1.5
1.2
Amara Raja Batteries
Buy
869
1,009
14,841
5,305
6,100
16.0
16.3
28.4
34.0
30.6
25.6
5.9
4.9
19.3
19.3
2.8
2.4
Exide Industries
Neutral
216
-
18,318
7,439
8,307
15.0
15.0
8.1
9.3
26.6
23.2
3.7
3.3
14.3
16.7
2.1
1.9
Apollo Tyres
Buy
179
235
9,134
12,877
14,504
14.3
13.9
21.4
23.0
8.4
7.8
1.3
1.1
16.4
15.2
0.9
0.8
Ceat
Buy
1,123
1,450
4,541
7,524
8,624
13.0
12.7
131.1
144.3
8.6
7.8
1.6
1.3
19.8
18.6
0.7
0.6
JK Tyres
Neutral
117
-
2,647
7,455
8,056
15.0
15.0
21.8
24.5
5.4
4.8
1.1
0.9
22.8
21.3
0.5
0.4
Swaraj Engines
Neutral
1,401
-
1,740
660
810
15.2
16.4
54.5
72.8
25.7
19.2
8.0
7.3
31.5
39.2
2.5
2.0
Subros
Neutral
195
-
1,167
1,488
1,681
11.7
11.9
6.4
7.2
30.4
27.2
3.2
2.9
10.8
11.4
1.0
0.9
Indag Rubber
Neutral
170
-
447
286
326
19.8
16.8
11.7
13.3
14.6
12.8
2.5
2.3
17.8
17.1
1.2
1.1
Capital Goods
ACE
Neutral
58
-
571
709
814
4.1
4.6
1.4
2.1
41.3
27.5
1.7
1.6
4.4
6.0
1.0
0.8
BEML
Neutral
1,286
-
5,356
3,451
4,055
6.3
9.2
31.4
57.9
41.0
22.2
2.5
2.2
6.3
10.9
1.7
1.4
Bharat Electronics
Neutral
1,527
-
34,099
8,137
9,169
16.8
17.2
58.7
62.5
26.0
24.4
4.0
3.6
44.6
46.3
3.2
2.8
Stock Watch
February 14, 2017
Company Name
Reco
CMP
Target
Mkt Cap
Sales ( Čcr )
OPM(%)
EPS (Č)
PER(x)
P/BV(x)
RoE(%)
EV/Sales(x)
(Č)
Price ( Č)
( Č cr )
FY17E
FY18E
FY17E
FY18E
FY17E
FY18E
FY17E
FY18E
FY17E
FY18E
FY17E
FY18E
FY17E
FY18E
Capital Goods
Voltas
Buy
340
407
11,237
6,511
7,514
7.9
8.7
12.9
16.3
26.3
20.8
4.7
4.2
16.7
18.5
1.5
1.3
BGR Energy
Neutral
141
-
1,020
16,567
33,848
6.0
5.6
7.8
5.9
18.1
24.0
1.0
1.0
4.7
4.2
0.2
0.1
BHEL
Neutral
155
-
37,975
28,797
34,742
-
2.8
2.3
6.9
67.5
22.5
1.2
1.1
1.3
4.8
1.0
0.7
Blue Star
Buy
549
634
5,242
4,283
5,077
5.9
7.3
14.9
22.1
36.9
24.8
7.2
6.0
20.4
26.4
1.3
1.1
Crompton Greaves
Neutral
67
-
4,187
5,777
6,120
5.9
7.0
3.3
4.5
20.2
14.8
0.9
0.9
4.4
5.9
0.7
0.6
Greaves Cotton
Neutral
138
-
3,376
1,755
1,881
16.8
16.9
7.8
8.5
17.7
16.3
3.5
3.3
20.6
20.9
1.6
1.5
Inox Wind
Neutral
182
-
4,034
5,605
6,267
15.7
16.4
24.8
30.0
7.3
6.1
2.0
1.5
25.9
24.4
0.8
0.6
KEC International
Neutral
169
-
4,341
9,294
10,186
7.9
8.1
9.9
11.9
17.1
14.2
2.5
2.2
15.6
16.3
0.7
0.6
KEI Industries
Buy
169
207
1,312
2,682
3,058
10.4
10.0
11.7
12.8
14.4
13.2
2.9
2.4
20.1
18.2
0.7
0.6
Thermax
Neutral
861
-
10,262
5,421
5,940
7.3
7.3
25.7
30.2
33.5
28.5
4.1
3.7
12.2
13.1
1.8
1.6
VATech Wabag
Buy
490
681
2,673
3,136
3,845
8.9
9.1
26.0
35.9
18.8
13.6
2.4
2.0
13.4
15.9
0.8
0.6
Cement
ACC
Neutral
1,485
-
27,887
11,225
13,172
13.2
16.9
44.5
75.5
33.4
19.7
3.2
2.9
11.2
14.2
2.5
2.1
Ambuja Cements
Neutral
239
-
47,447
9,350
10,979
18.2
22.5
5.8
9.5
41.2
25.2
3.5
3.1
10.2
12.5
5.1
4.3
India Cements
Neutral
160
-
4,916
4,364
4,997
18.5
19.2
7.9
11.3
20.3
14.2
1.5
1.4
8.0
8.5
1.9
1.6
JK Cement
Neutral
847
-
5,921
4,398
5,173
15.5
17.5
31.2
55.5
27.1
15.3
3.3
2.8
12.0
15.5
1.9
1.6
J K Lakshmi Cement
Buy
387
565
4,554
2,913
3,412
14.5
19.5
7.5
22.5
51.6
17.2
3.2
2.7
12.5
18.0
2.2
1.8
Orient Cement
Buy
140
215
2,865
2,114
2,558
18.5
20.5
8.1
11.3
17.3
12.4
2.5
2.2
9.0
14.0
2.0
1.5
UltraTech Cement
Neutral
3,774
-
103,579
25,768
30,385
21.0
23.5
111.0
160.0
34.0
23.6
4.3
3.8
13.5
15.8
4.1
3.4
Construction
ITNL
Neutral
106
-
3,487
8,946
10,017
31.0
31.6
8.1
9.1
13.1
11.7
0.5
0.5
4.2
5.0
3.7
3.5
KNR Constructions
Neutral
177
-
2,492
1,385
1,673
14.7
14.0
41.2
48.5
4.3
3.7
0.8
0.7
14.9
15.2
1.9
1.6
Larsen & Toubro
Accumulate
1,497
1,634
139,645
111,017
124,908
11.0
11.0
61.1
66.7
24.5
22.4
2.9
2.7
13.1
12.9
2.3
2.1
Gujarat Pipavav Port
Neutral
165
-
7,970
705
788
52.2
51.7
5.0
5.6
33.0
29.4
3.3
2.9
11.2
11.2
11.0
9.3
Nagarjuna Const.
Neutral
85
-
4,742
8,842
9,775
9.1
8.8
5.3
6.4
16.1
13.3
1.3
1.2
8.2
9.1
0.7
0.6
PNC Infratech
Buy
105
143
2,687
2,350
2,904
13.1
13.2
9.0
8.8
11.6
11.9
0.4
0.4
15.9
13.9
1.3
1.0
Simplex Infra
Neutral
308
-
1,526
6,829
7,954
10.5
10.5
31.4
37.4
9.8
8.3
1.0
0.9
9.9
13.4
0.6
0.5
Power Mech Projects
Neutral
451
-
663
1,801
2,219
12.7
14.6
72.1
113.9
6.3
4.0
1.2
1.0
16.8
11.9
0.4
0.3
Sadbhav Engineering
Accumulate
283
298
4,851
3,598
4,140
10.3
10.6
9.0
11.9
31.4
23.8
3.3
2.9
9.9
11.9
1.6
1.4
NBCC
Neutral
282
-
16,935
7,428
9,549
7.9
8.6
8.2
11.0
34.4
25.7
1.7
1.4
28.2
28.7
2.0
1.5
MEP Infra
Neutral
40
-
655
1,877
1,943
30.6
29.8
3.0
4.2
13.4
9.6
6.5
4.4
0.6
0.6
1.7
1.6
Stock Watch
February 14, 2017
Company Name
Reco
CMP
Target
Mkt Cap
Sales ( Čcr )
OPM(%)
EPS (Č)
PER(x)
P/BV(x)
RoE(%)
EV/Sales(x)
(Č)
Price ( Č)
( Č cr )
FY17E
FY18E
FY17E
FY18E
FY17E
FY18E
FY17E
FY18E
FY17E
FY18E
FY17E
FY18E
FY17E
FY18E
Construction
SIPL
Neutral
97
-
3,401
1,036
1,252
65.5
66.2
(8.4)
(5.6)
3.6
4.1
(22.8)
(15.9)
11.5
9.6
Engineers India
Neutral
152
-
10,226
1,725
1,935
16.0
19.1
11.4
13.9
13.3
10.9
1.8
1.8
13.4
15.3
4.9
4.3
Financials
Axis Bank
Buy
490
580
117,267
46,932
53,575
3.5
3.4
32.4
44.6
15.2
11.0
2.0
1.7
13.6
16.5
-
-
Bank of Baroda
Neutral
169
-
38,883
19,980
23,178
1.8
1.8
11.5
17.3
14.7
9.8
1.7
1.4
8.3
10.1
-
-
Canara Bank
Neutral
300
-
16,314
15,225
16,836
1.8
1.8
14.5
28.0
20.7
10.7
1.4
1.2
5.8
8.5
-
-
Can Fin Homes
Accumulate
1,924
2,128
5,121
420
526
3.5
3.5
86.5
107.8
22.2
17.8
4.8
3.9
23.6
24.1
-
-
Cholamandalam Inv. &
Buy
1,017
1,230
15,886
2,012
2,317
6.3
6.3
42.7
53.6
23.8
19.0
3.8
3.2
16.9
18.3
-
-
Fin. Co.
Dewan Housing Finance Accumulate
307
350
9,605
2,225
2,688
2.9
2.9
29.7
34.6
10.3
8.9
1.7
1.4
16.1
16.8
-
-
Equitas Holdings
Buy
184
235
6,161
939
1,281
11.7
11.5
5.8
8.2
31.7
22.4
2.7
2.4
10.9
11.5
-
-
Federal Bank
Neutral
84
-
14,436
8,259
8,995
3.0
3.0
4.3
5.6
19.5
15.0
1.7
1.5
8.5
10.1
-
-
HDFC
Neutral
1,394
-
220,967
11,475
13,450
3.4
3.4
45.3
52.5
30.8
26.6
5.9
5.2
20.2
20.5
-
-
HDFC Bank
Neutral
1,310
-
334,557
46,097
55,433
4.5
4.5
58.4
68.0
22.4
19.3
3.9
3.3
18.8
18.6
-
-
ICICI Bank
Accumulate
282
315
163,970
42,800
44,686
3.1
3.3
18.0
21.9
15.7
12.9
2.1
2.0
11.1
12.3
-
-
Lakshmi Vilas Bank
Accumulate
152
174
2,912
3,339
3,799
2.7
2.8
11.0
14.0
13.8
10.9
1.4
1.3
11.2
12.7
-
-
LIC Housing Finance
Accumulate
554
630
27,976
3,712
4,293
2.6
2.5
39.0
46.0
14.2
12.1
2.7
2.3
19.9
20.1
-
-
Punjab Natl.Bank
Neutral
142
-
30,302
23,532
23,595
2.3
2.4
6.8
12.6
20.9
11.3
3.2
2.3
3.3
6.5
-
-
RBL Bank
Neutral
393
-
14,528
1,783
2,309
2.6
2.6
12.7
16.4
30.9
24.0
3.4
3.0
12.8
13.3
-
-
South Ind.Bank
Neutral
23
-
3,082
6,435
7,578
2.5
2.5
2.7
3.1
8.4
7.4
1.1
0.9
10.1
11.2
-
-
St Bk of India
Neutral
271
-
216,401
88,650
98,335
2.6
2.6
13.5
18.8
20.1
14.4
1.9
1.7
7.0
8.5
-
-
Union Bank
Neutral
146
-
10,037
13,450
14,925
2.3
2.3
25.5
34.5
5.7
4.2
0.8
0.7
7.5
10.2
-
-
Yes Bank
Neutral
1,452
-
61,414
8,978
11,281
3.3
3.4
74.0
90.0
19.6
16.1
3.7
3.2
17.0
17.2
-
-
FMCG
Asian Paints
Neutral
984
-
94,414
17,128
18,978
16.8
16.4
19.1
20.7
51.5
47.6
17.9
16.9
34.8
35.5
5.4
4.9
Britannia
Accumulate
3,273
3,626
39,276
9,594
11,011
14.6
14.9
80.3
94.0
40.8
34.8
16.8
12.9
41.2
-
4.0
3.4
Colgate
Accumulate
888
995
24,156
4,605
5,149
23.4
23.4
23.8
26.9
37.3
33.0
20.7
16.2
64.8
66.8
5.2
4.6
Dabur India
Accumulate
268
304
47,288
8,315
9,405
19.8
20.7
8.1
9.2
33.1
29.2
9.2
7.7
31.6
31.0
5.3
4.7
GlaxoSmith Con*
Neutral
5,118
-
21,524
4,350
4,823
21.2
21.4
179.2
196.5
28.6
26.1
7.6
6.4
27.1
26.8
4.3
3.8
Godrej Consumer
Neutral
1,553
-
52,895
10,235
11,428
18.4
18.6
41.1
44.2
37.8
35.1
8.4
7.1
24.9
24.8
5.3
4.6
HUL
Neutral
863
-
186,755
35,252
38,495
17.8
17.8
20.7
22.4
41.8
38.6
39.9
34.3
95.6
88.9
5.1
4.7
ITC
Neutral
271
-
327,883
40,059
44,439
38.3
39.2
9.0
10.1
30.1
26.7
8.4
7.3
27.8
27.5
7.7
6.9
Stock Watch
February 14, 2017
Company Name
Reco
CMP
Target
Mkt Cap
Sales ( Čcr )
OPM(%)
EPS (Č)
PER(x)
P/BV(x)
RoE(%)
EV/Sales(x)
(Č)
Price ( Č)
( Č cr )
FY17E FY18E
FY17E
FY18E
FY17E
FY18E
FY17E
FY18E
FY17E
FY18E
FY17E
FY18E
FY17E
FY18E
FMCG
Marico
Accumulate
269
300
34,763
6,430
7,349
18.8
19.5
6.4
7.7
42.1
35.0
12.7
10.7
33.2
32.5
5.2
4.5
Nestle*
Neutral
6,181
-
59,592
10,073
11,807
20.7
21.5
124.8
154.2
49.5
40.1
20.3
18.3
34.8
36.7
5.7
4.9
Tata Global
Neutral
142
-
8,959
8,675
9,088
9.8
9.8
7.4
8.2
19.2
17.3
2.2
2.1
7.9
8.1
1.0
0.9
Procter & Gamble
Accumulate
7,005
7,369
22,739
2,939
3,342
23.2
23.0
146.2
163.7
47.9
42.8
107.3
102.9
25.3
23.5
7.3
6.3
Hygiene
IT
HCL Tech^
Buy
827
1,000
116,699
49,242
57,168
20.5
20.5
55.7
64.1
14.9
12.9
3.0
2.3
20.3
17.9
2.2
1.8
Infosys
Buy
984
1,249
225,905
68,350
77,326
27.0
27.0
62.5
69.4
15.7
14.2
3.4
3.1
21.3
21.6
2.8
2.4
TCS
Accumulate
2,410
2,620
474,932
119,025
133,308
27.6
27.6
131.2
145.5
18.4
16.6
6.0
5.5
32.4
33.1
3.8
3.3
Tech Mahindra
Buy
499
600
48,598
29,673
32,937
15.5
17.0
32.8
39.9
15.2
12.5
3.0
2.6
19.6
20.7
1.4
1.2
Wipro
Buy
475
583
115,454
55,440
60,430
18.1
18.1
36.1
38.9
13.2
12.2
2.4
2.2
19.0
17.6
1.8
1.6
Media
D B Corp
Neutral
379
-
6,970
2,297
2,590
27.4
28.2
21.0
23.4
18.1
16.2
4.2
3.7
23.7
23.1
2.8
2.4
HT Media
Neutral
85
-
1,983
2,693
2,991
12.6
12.9
7.9
9.0
10.8
9.5
0.9
0.8
7.8
8.3
0.3
0.2
Jagran Prakashan
Buy
187
225
6,105
2,355
2,635
28.0
28.0
10.8
12.5
17.3
14.9
3.8
3.2
21.7
21.7
2.6
2.3
Sun TV Network
Neutral
714
-
28,118
2,850
3,265
70.1
71.0
26.2
30.4
27.2
23.5
7.0
6.2
24.3
25.6
9.5
8.1
Hindustan Media
Neutral
276
-
2,024
1,016
1,138
24.3
25.2
27.3
30.1
10.1
9.2
1.9
1.7
16.2
15.8
1.3
1.1
Ventures
TV Today Network
Buy
270
385
1,611
637
743
27.5
27.5
18.4
21.4
14.7
12.6
2.6
2.2
17.4
17.2
2.1
1.7
Metals & Mining
Coal India
Neutral
321
-
199,227
84,638
94,297
21.4
22.3
24.5
27.1
13.1
11.8
5.5
5.2
42.6
46.0
1.9
1.7
Hind. Zinc
Neutral
315
-
133,224
14,252
18,465
55.9
48.3
15.8
21.5
20.0
14.7
3.3
2.8
17.0
20.7
9.4
7.2
Hindalco
Neutral
185
-
38,224
107,899
112,095
7.4
8.2
9.2
13.0
20.1
14.2
1.0
0.9
4.8
6.6
0.9
0.8
JSW Steel
Neutral
188
-
45,395
53,201
58,779
16.1
16.2
130.6
153.7
1.4
1.2
0.2
0.2
14.0
14.4
1.6
1.4
NMDC
Neutral
145
-
45,956
6,643
7,284
44.4
47.7
7.1
7.7
20.5
18.9
1.8
1.7
8.8
9.2
4.7
4.2
SAIL
Neutral
62
-
25,483
47,528
53,738
(0.7)
2.1
(1.9)
2.6
23.7
0.7
0.6
(1.6)
3.9
1.4
1.3
Vedanta
Neutral
256
-
75,941
71,744
81,944
19.2
21.7
13.4
20.1
19.1
12.7
1.6
1.5
8.4
11.3
1.4
1.1
Tata Steel
Neutral
473
-
45,890
121,374
121,856
7.2
8.4
18.6
34.3
25.4
13.8
1.6
1.5
6.1
10.1
1.0
1.0
Oil & Gas
Cairn India
Neutral
281
-
52,740
9,127
10,632
4.3
20.6
8.8
11.7
32.0
24.0
1.0
1.0
3.3
4.2
7.2
6.0
GAIL
Neutral
481
-
61,039
56,220
65,198
9.3
10.1
27.1
33.3
17.8
14.5
1.6
1.5
9.3
10.7
1.3
1.1
ONGC
Neutral
192
-
246,527
137,222
152,563
15.0
21.8
19.5
24.1
9.9
8.0
0.8
0.8
8.5
10.1
2.1
1.9
Indian Oil Corp
Neutral
380
-
184,476
373,359
428,656
5.9
5.5
54.0
59.3
7.0
6.4
1.1
1.0
16.0
15.6
0.6
0.6
Reliance Industries
Neutral
1,028
-
333,555
301,963
358,039
12.1
12.6
87.7
101.7
11.7
10.1
1.2
1.1
10.7
11.3
1.6
1.3
Pharmaceuticals
Alembic Pharma
Neutral
556
-
10,483
3,483
4,083
20.2
21.4
24.3
30.4
22.9
18.3
5.2
4.2
25.5
25.3
2.9
2.4
Stock Watch
February 14, 2017
Company Name
Reco
CMP
Target
Mkt Cap
Sales ( Čcr )
OPM(%)
EPS (Č)
PER(x)
P/BV(x)
RoE(%)
EV/Sales(x)
(Č)
Price ( Č)
( Č cr )
FY17E
FY18E
FY17E
FY18E
FY17E
FY18E
FY17E
FY18E
FY17E
FY18E
FY17E
FY18E
FY17E
FY18E
Pharmaceuticals
Alkem Laboratories Ltd
Accumulate
1,847
1,989
22,088
6,043
6,893
18.7
19.3
80.5
88.8
23.0
20.8
5.1
4.2
22.3
20.3
3.6
3.1
Aurobindo Pharma
Buy
664
877
38,835
15,720
18,078
23.7
23.7
41.4
47.3
16.0
14.0
4.2
3.3
29.6
26.1
2.7
2.3
Aventis*
Neutral
4,172
-
9,609
2,277
2,597
17.3
18.3
149.4
172.0
27.9
24.3
4.6
3.7
25.1
28.8
3.9
3.2
Cadila Healthcare
Accumulate
372
400
38,078
10,429
12,318
22.6
22.0
16.9
19.2
22.0
19.4
5.6
4.5
28.5
25.7
3.7
3.0
Cipla
Sell
581
490
46,761
15,378
18,089
17.4
18.4
21.6
27.2
26.9
21.4
3.5
3.0
13.7
15.2
3.2
2.7
Dr Reddy's
Neutral
2,965
-
49,124
16,043
18,119
20.8
22.4
112.4
142.9
26.4
20.8
3.5
3.1
14.1
15.9
3.0
2.7
Dishman Pharma
Neutral
225
-
3,627
1,718
1,890
22.7
22.8
9.5
11.3
23.7
19.9
2.3
2.1
10.1
10.9
2.6
2.2
GSK Pharma*
Neutral
2,700
-
22,866
3,000
3,312
15.4
20.6
46.5
60.8
58.1
44.4
13.9
13.9
26.3
30.6
7.4
6.7
Indoco Remedies
Reduce
270
240
2,487
1,112
1,289
16.2
18.2
11.6
16.0
23.3
16.9
3.7
3.1
17.0
20.1
2.4
2.0
Ipca labs
Buy
522
613
6,582
3,303
3,799
15.3
15.3
17.3
19.7
30.2
26.5
2.6
2.4
9.1
9.4
2.1
1.8
Lupin
Buy
1,448
1,809
65,341
15,912
18,644
26.4
26.7
58.1
69.3
24.9
20.9
4.9
4.0
21.4
20.9
4.2
3.4
Sun Pharma
Buy
655
847
157,136
31,129
35,258
32.0
32.9
30.2
35.3
21.7
18.6
3.5
2.9
20.0
20.1
4.6
3.9
Power
Tata Power
Neutral
83
-
22,558
36,916
39,557
17.4
27.1
5.1
6.3
16.4
13.2
1.4
1.3
9.0
10.3
1.6
1.5
NTPC
Neutral
172
-
142,069
86,605
95,545
17.5
20.8
11.8
13.4
14.6
12.9
1.5
1.4
10.5
11.1
3.0
3.0
Power Grid
Accumulate
203
223
106,227
25,315
29,193
88.2
88.7
14.2
17.2
14.4
11.8
2.2
1.9
15.2
16.1
8.8
7.9
Real Estate
Prestige Estate
Buy
175
210
6,570
4,707
5,105
25.2
26.0
10.3
13.0
17.0
13.5
1.4
1.3
10.3
10.2
2.6
2.3
MLIFE
Buy
348
522
1,430
1,152
1,300
22.7
24.6
29.9
35.8
11.7
9.7
0.9
0.8
7.6
8.6
2.0
1.6
Telecom
Bharti Airtel
Neutral
358
-
143,167
105,086
114,808
34.5
34.7
12.2
16.4
29.4
21.8
2.0
1.9
6.8
8.4
2.3
2.0
Idea Cellular
Neutral
107
-
38,678
40,133
43,731
37.2
37.1
6.4
6.5
16.8
16.5
1.4
1.3
8.2
7.6
2.0
1.7
zOthers
Abbott India
Neutral
4,462
-
9,482
3,153
3,583
14.1
14.4
152.2
182.7
29.3
24.4
144.0
122.9
25.6
26.1
2.7
2.3
Asian Granito
Buy
275
351
827
1,060
1,169
12.2
12.5
12.7
15.9
21.7
17.3
2.1
1.8
9.5
10.7
1.1
0.9
Bajaj Electricals
Accumulate
264
295
2,676
4,801
5,351
5.7
6.2
10.4
13.7
25.4
19.3
3.1
2.8
12.4
14.5
0.6
0.5
Banco Products (India)
Neutral
198
-
1,415
1,353
1,471
12.3
12.4
14.5
16.3
13.7
12.1
18.9
17.0
14.5
14.6
1.0
105.7
Coffee Day Enterprises
Neutral
238
-
4,910
2,964
3,260
20.5
21.2
4.7
8.0
-
29.8
2.8
2.5
5.5
8.5
2.1
1.8
Ltd
Competent Automobiles Neutral
178
-
109
1,137
1,256
3.1
2.7
28.0
23.6
6.4
7.5
34.2
30.9
14.3
11.5
0.1
0.1
Elecon Engineering
Neutral
55
-
620
1,482
1,660
13.7
14.5
3.9
5.8
14.2
9.5
3.3
3.1
7.8
10.9
0.7
0.7
Finolex Cables
Neutral
469
-
7,166
2,883
3,115
12.0
12.1
14.2
18.6
33.0
25.2
17.6
15.3
15.8
14.6
2.2
2.0
Garware Wall Ropes
Neutral
607
-
1,328
873
938
14.3
14.3
35.2
37.5
17.3
16.2
3.0
2.6
17.5
15.9
1.4
1.3
Goodyear India*
Neutral
723
-
1,668
1,598
1,704
10.4
10.2
49.4
52.6
14.6
13.8
67.6
59.3
18.2
17.0
0.7
101.4
Stock Watch
February 14, 2017
Company Name
Reco
CMP
Target
Mkt Cap
Sales ( Čcr )
OPM(%)
EPS (Č)
PER(x)
P/BV(x)
RoE(%)
EV/Sales(x)
(Č)
Price ( Č)
( Č cr )
FY17E
FY18E
FY17E
FY18E
FY17E
FY18E
FY17E
FY18E
FY17E
FY18E
FY17E
FY18E
FY17E
FY18E
zOthers
Hitachi
Neutral
1,374
-
3,735
2,081
2,433
8.8
8.9
33.4
39.9
41.1
34.4
33.2
27.7
22.1
21.4
1.8
1.5
HSIL
Neutral
291
-
2,103
2,384
2,515
15.8
16.3
15.3
19.4
19.0
15.0
18.9
16.3
7.8
9.3
1.1
1.0
Interglobe Aviation
Neutral
831
-
30,020
21,122
26,005
14.5
27.6
110.7
132.1
7.5
6.3
44.9
32.1
168.5
201.1
1.4
1.1
Jyothy Laboratories
Neutral
350
-
6,351
1,440
2,052
11.5
13.0
8.5
10.0
41.1
35.0
10.0
9.2
18.6
19.3
4.7
3.3
Kirloskar Engines India
Neutral
355
-
5,127
2,554
2,800
9.9
10.0
10.5
12.1
33.8
29.3
14.1
13.3
10.7
11.7
1.6
1.5
Ltd
Linc Pen & Plastics
Neutral
262
-
387
382
420
9.3
9.5
13.5
15.7
19.4
16.7
3.3
2.9
17.1
17.3
1.1
1.0
M M Forgings
Neutral
476
-
574
546
608
20.4
20.7
41.3
48.7
11.5
9.8
65.2
57.7
16.6
17.0
0.9
0.8
Manpasand Bever.
Neutral
685
-
3,917
836
1,087
19.6
19.4
16.9
23.8
40.5
28.7
4.9
4.3
12.0
14.8
4.4
3.3
Mirza International
Buy
92
107
1,107
1,024
1,148
18.0
18.0
6.9
8.0
13.4
11.5
2.3
1.9
16.6
16.3
1.3
1.1
MT Educare
Neutral
126
-
502
366
417
17.7
18.2
9.4
10.8
13.5
11.7
3.0
2.6
22.2
22.3
1.3
1.1
Narayana Hrudaya
Neutral
329
-
6,731
1,873
2,166
11.5
11.7
2.6
4.0
124.5
83.1
7.6
6.9
6.1
8.3
3.7
3.2
Navkar Corporation
Buy
174
265
2,476
369
561
42.9
42.3
7.2
11.5
24.1
15.1
1.8
1.6
7.4
10.5
7.7
5.1
Navneet Education
Neutral
148
-
3,455
1,062
1,147
24.0
24.0
6.1
6.6
24.3
22.3
5.0
4.4
20.6
19.8
3.3
3.1
Nilkamal
Neutral
1,696
-
2,531
1,995
2,165
10.7
10.4
69.8
80.6
24.3
21.0
96.9
84.2
16.6
16.5
1.3
1.1
Page Industries
Neutral
14,327
-
15,980
2,450
3,124
20.1
17.6
299.0
310.0
47.9
46.2
319.1
243.6
47.1
87.5
6.6
5.2
Parag Milk Foods
Neutral
269
-
2,266
1,919
2,231
9.3
9.6
9.5
12.9
28.5
20.8
4.4
3.7
15.5
17.5
1.3
1.1
Quick Heal
Neutral
258
-
1,810
408
495
27.3
27.0
7.7
8.8
33.4
29.4
3.1
3.1
9.3
10.6
3.6
3.0
Radico Khaitan
Buy
123
147
1,635
1,667
1,824
13.0
13.2
6.7
8.2
18.5
15.0
1.7
1.5
9.0
10.2
1.4
1.2
Relaxo Footwears
Neutral
435
-
5,224
2,085
2,469
9.2
8.2
7.6
8.0
57.5
54.7
22.3
19.0
17.9
18.8
2.6
2.2
S H Kelkar & Co.
Neutral
318
-
4,604
1,036
1,160
15.1
15.0
6.1
7.2
52.1
44.4
5.6
5.1
10.7
11.5
4.3
3.8
Siyaram Silk Mills
Neutral
1,640
-
1,538
1,652
1,857
11.6
11.7
92.4
110.1
17.7
14.9
2.6
2.3
14.7
15.2
1.1
1.0
Styrolution ABS India*
Neutral
609
-
1,071
1,440
1,537
9.2
9.0
40.6
42.6
15.0
14.3
38.3
34.8
12.3
11.6
0.7
0.6
Surya Roshni
Neutral
185
-
810
3,342
3,625
7.8
7.5
17.3
19.8
10.7
9.4
20.3
16.3
10.5
10.8
0.5
0.5
Team Lease Serv.
Neutral
881
-
1,506
3,229
4,001
1.5
1.8
22.8
32.8
38.7
26.8
4.1
3.6
10.7
13.4
0.4
0.3
The Byke Hospitality
Neutral
157
-
629
287
384
20.5
20.5
7.6
10.7
20.6
14.7
4.3
3.5
20.7
23.5
2.2
1.6
Transport Corporation of
Neutral
192
-
1,470
2,671
2,911
8.5
8.8
13.9
15.7
13.9
12.3
1.9
1.7
13.7
13.8
0.7
0.6
India
TVS Srichakra
Neutral
3,084
-
2,361
2,304
2,614
13.7
13.8
231.1
266.6
13.3
11.6
346.5
272.8
33.9
29.3
1.0
0.9
UFO Moviez
Neutral
419
-
1,155
619
685
33.2
33.4
30.0
34.9
14.0
12.0
1.9
1.7
13.8
13.9
1.6
1.2
Visaka Industries
Neutral
219
-
348
1,051
1,138
10.3
10.4
21.0
23.1
10.4
9.5
28.1
26.3
9.0
9.2
0.6
0.6
Stock Watch
February 14, 2017
Company Name
Reco
CMP
Target Mkt Cap
Sales ( Čcr )
OPM(%)
EPS (Č)
PER(x)
P/BV(x)
RoE(%)
EV/Sales(x)
(Č)
Price ( Č)
( Č cr )
FY17E FY18E FY17E FY18E FY17E FY18E FY17E FY18E FY17E FY18E FY17E FY18E FY17E FY18E
zOthers
VRL Logistics
Neutral
302
-
2,756
1,902
2,119
16.7
16.6
14.6
16.8
20.7
18.0
4.5
4.0
21.9
22.2
1.6
1.4
Wonderla Holidays
Neutral
376
-
2,124
287
355
38.0
40.0
11.3
14.2
33.3
26.5
4.8
4.2
21.4
23.9
7.1
5.7
Source: Company, Angel Research; Note: *December year end; #September year end; &October year end; Price as on February 13, 2017
Market Outlook
February 14, 2017
Research Team Tel: 022 - 39357800
DISCLAIMER
Angel Broking Private Limited (hereinafter referred to as “Angel”) is a registered Member of National Stock Exchange of India
Limited,Bombay Stock Exchange Limited and Metropolitan Stock Exchange Limited. It is also registered as a Depository Participant with
CDSL and Portfolio Manager with SEBI. It also has registration with AMFI as a Mutual Fund Distributor. Angel Broking Private Limited is a
registered entity with SEBI for Research Analyst in terms of SEBI (Research Analyst) Regulations, 2014 vide registration number
INH000000164. Angel or its associates has not been debarred/ suspended by SEBI or any other regulatory authority for accessing
/dealing in securities Market. Angel or its associates/analyst has not received any compensation / managed or
co-managed public offering of securities of the company covered by Analyst during the past twelve months.
This document is solely for the personal information of the recipient, and must not be singularly used as the basis of any investment
decision. Nothing in this document should be construed as investment or financial advice. Each recipient of this document should make
such investigations as they deem necessary to arrive at an independent evaluation of an investment in the securities of the companies
referred to in this document (including the merits and risks involved), and should consult their own advisors to determine the merits and
risks of such an investment.
Reports based on technical and derivative analysis center on studying charts of a stock's price movement, outstanding positions and
trading volume, as opposed to focusing on a company's fundamentals and, as such, may not match with a report on a company's
fundamentals. Investors are advised to refer the Fundamental and Technical Research Reports available on our website to evaluate the
contrary view, if any.
The information in this document has been printed on the basis of publicly available information, internal data and other reliable
sources believed to be true, but we do not represent that it is accurate or complete and it should not be relied on as such, as this
document is for general guidance only. Angel Broking Pvt. Limited or any of its affiliates/ group companies shall not be in any way
responsible for any loss or damage that may arise to any person from any inadvertent error in the information contained in this report.
Angel Broking Pvt. Limited has not independently verified all the information contained within this document. Accordingly, we cannot
testify, nor make any representation or warranty, express or implied, to the accuracy, contents or data contained within this document.
While Angel Broking Pvt. Limited endeavors to update on a reasonable basis the information discussed in this material, there may be
regulatory, compliance, or other reasons that prevent us from doing so.
This document is being supplied to you solely for your information, and its contents, information or data may not be reproduced,
redistributed or passed on, directly or indirectly.
Neither Angel Broking Pvt. Limited, nor its directors, employees or affiliates shall be liable for any loss or damage that may arise from
or in connection with the use of this information.